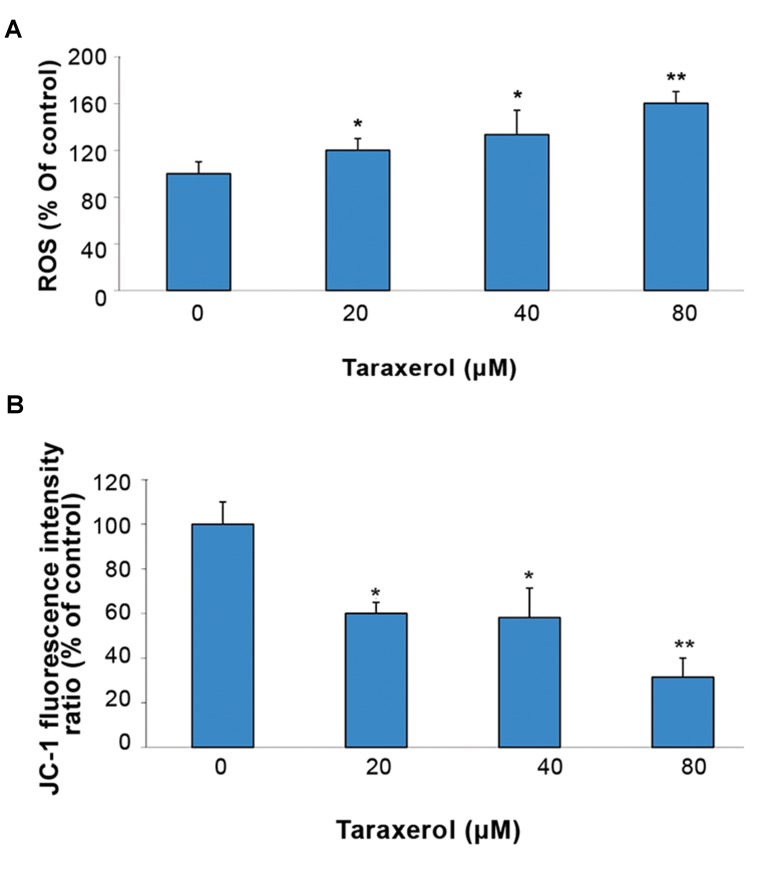
Fig.3.
Effect of taraxerol on oxidative stress. Cells were incubated with or without taraxerol (20, 40, 80 μM) for 8 hours. A. Reactive oxygen species (ROS) were detected with DCFH2-DA and we calculated the fluorescence intensity and B. Mitochondrial membrane potential (MMP, Δψm) was evaluated by staining with JC-1 and analysis by a microplate reader. The quantitative Δψm from each group is expressed as the ratio of red (JC-1 aggregates)/green (JC-1 monomers). Data was expressed as a percentage of untreated controls. All experiments were repeated three times. The data are expressed as mean ± SD (n=3).
*; P<0.05 and **; P<0.01 vs. control.

