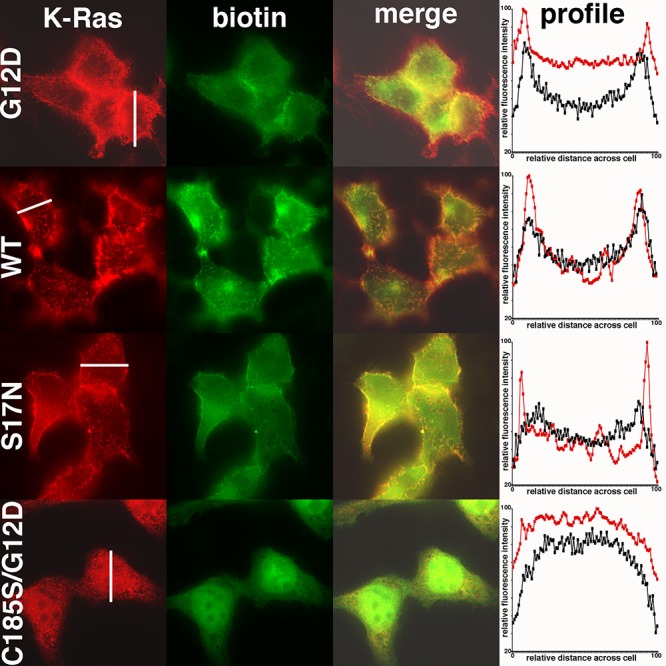
Figure 2. Localization of BirA*Ras and biotinylated proteins in transfected cells. Cells expressing the indicated BirA*Ras proteins were processed to detect the BirA*Ras proteins with an anti-Myc antibody (K-Ras; red), and a fluorescently tagged streptavidin reagent to detect biotinylated proteins (biotin; green). Exposure times for biotinylated proteins were set at 10 ms, to minimize imaging of endogenously biotinylated proteins. The merge column shows the overlap BirA*Ras (K-Ras) and biotinylated protein (biotin) signals. Pearson’s correlation coefficients, determined from 20 cells for each sample, indicated high degree of co-localization and were as follows: G12D, 0.84±0.06; WT, 0.82±0.06; S17N, 0.86±0.04; C185S/G12D, 0.93±0.03. In the rightmost column (profile), fluorescence brightness profiles across cells, from one cell edge (0) to the opposite cell edge (100) were plotted. The red line plots derive from the cells indicated with white lines in the K-Ras column. The black line plots were averaged from a minimum of 13 cells for each sample, and indicate that G12D, WT, and S17N BirA*Ras proteins preferentially localized to cell edges, while the C185S/G12D protein appeared enriched intracellularly.

