. 2017 Jul 3;14(4):241–251. doi: 10.21873/cgp.20035

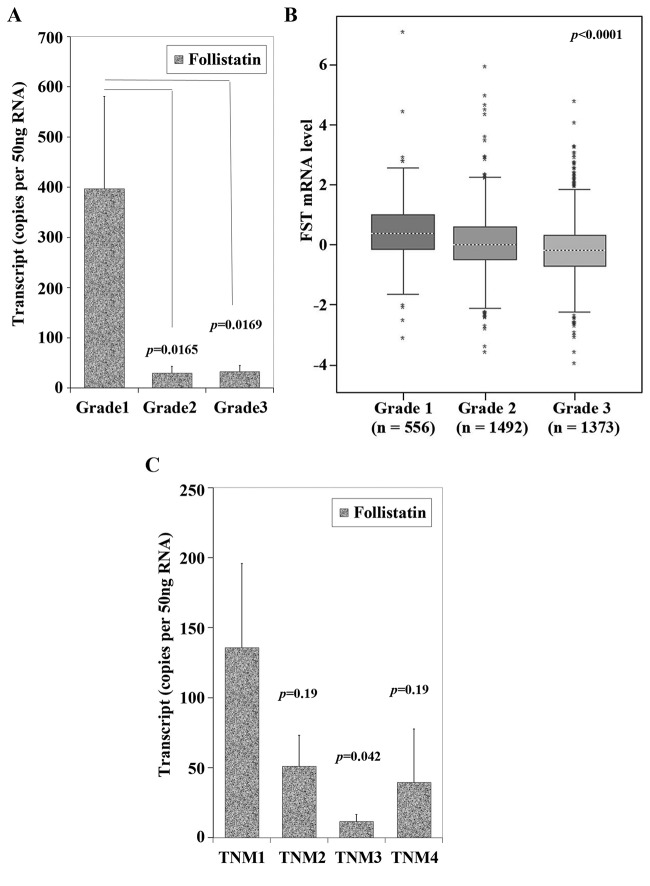
Figure 5. Expression of FST is associated with tumour grade and TNM staging. A) FST qPCR transcript levels from our clinical cohort according to patient’s histological tumour grade. The X axis represents tumour grade, a reflection of how differentiated and therefore how ‘aggressive’ it’s potential for invasion. Grade 1 is well differentiated, Grade 2 is moderately differentiated, whilst Grade 3 is poorly differentiated tumour. Those with grade 2 and 3 tumours had lower FST levels than grade 1 (p=0.0165 and 0.0169 respectively). B) Gene expression miner uses publicly available patient expression data from patient breast cancer tissue. Low FST expression correlated with higher grade, poorly differentiated breast tumours (p<0.0001), similar to our cohort in panel A. C) FST qPCR transcript levels according to TNM staging. Those tumours that are TNM stage 1 (i.e. smaller size, with less nodal and distant metastases) had higher FST expression than TNM 2, 3 and 4 (p=0.19, 0.042 and 0.19 respectively).

Figure 5