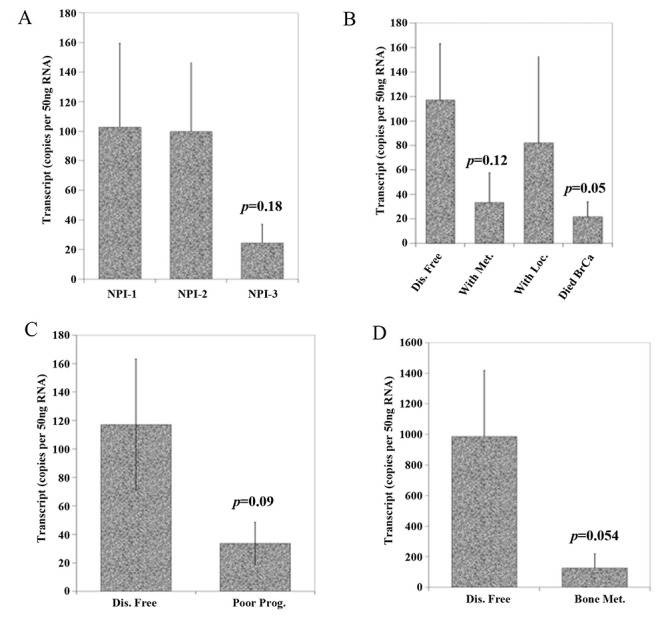
Figure 6. A) FST qPCR transcript levels according to patient’s Nottingham Prognostic Index level. Those with lower FST has a poorer prognostic score, but this does not reach significance (p=0.18). B) FST qPCR transcript levels according to disease outcomes showing those that died from their disease have a lower FST expression compared to those remaining disease free (p=0.05). C) and D) FST expression transcripts were higher in those remaining disease-free compared to those with poor prognosis (all though this did not reach significance p=0.09) and those with bone metastases (p=0.054).

