. 2017 Jul 3;14(4):253–266. doi: 10.21873/cgp.20036

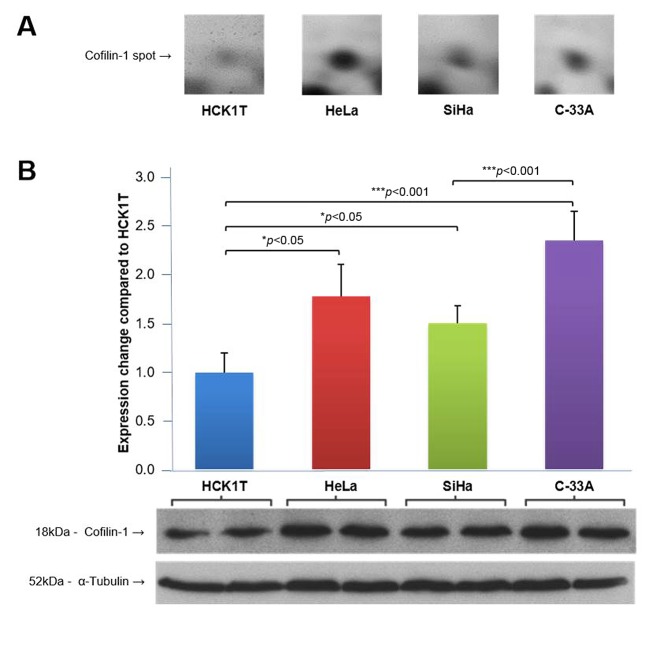
Figure 6. Cofilin-1 levels in cervical cell lines. A. Cofilin-1 levels in proteomics analysis. Fold change is expressed in comparison with HCK1T, as the average from the two identified spots on 2D gels, measured with PDQuest software. B. Cofilin-1 levels in western blot analysis. Fold change is expressed in comparison with HCK1T representing the average from four biological replicates for each cell line, measured with the Quantity One 1-D Analysis software (Bio-Rad). Tubulin levels were used for signal normalization in western blots. Mean values and standard deviation bars are shown for each cell line, and p-value was calculated with Student’s t-test.

Figure 6