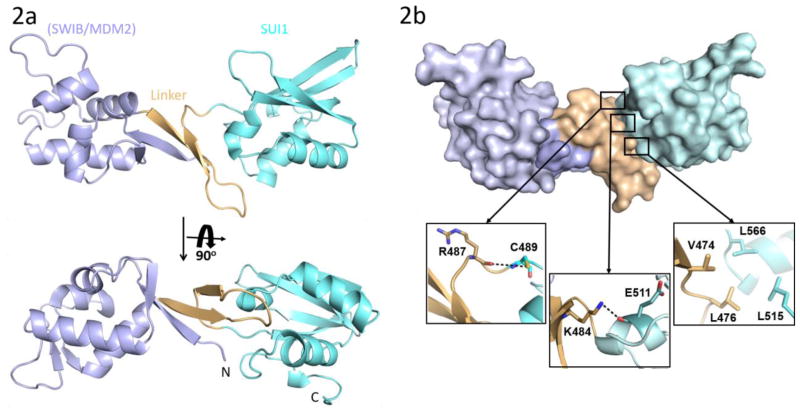
Figure 2.
(a) Crystal structure of heIF2D (C-term). The SWIB/MDM2 (blue), linker (orange) and SUI1 (cyan) domains are color coded similar to Figure 1(a). (b) Space filling representation of heIF2D (C-term) showing the extensive surface contacts between the linker and the SUI1, SWIB/MDM2 domains. The hydrophobic and hydrogen bonding interactions between the Linker and the SUI1 domain are shown in the inserts. Pymol was used to calculate the surface area and to make the figure.

