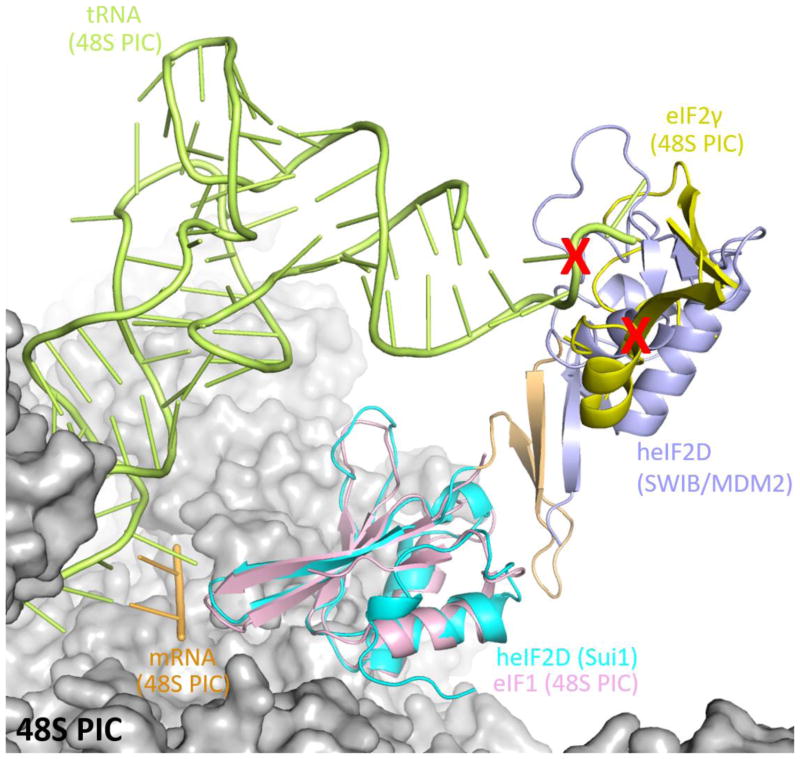
Figure 4.
Superposition of heIF2D (C-term) on the eIF1 of the 48S pre-initiation complex (48S PIC, PDB: 3JAQ) reveals clashes (red cross) with the initiator tRNA and eIF2γ. The 48S PIC is represented as surface model, while the eIF1 (pink), initiator tRNA (green), mRNA (gold) and eIF2γ (yellow) of the 48S PIC are represented as cartoon model. Only the regions of eIF2γ that clash with eIF2D are shown here, while the rest of eIF2γ along with eIF2β and eIF2α are not shown for clarity. The domains of eIF2D are colored the same as in Figure 2(a). The superposition was done in COOT and the figure was made in Pymol.

