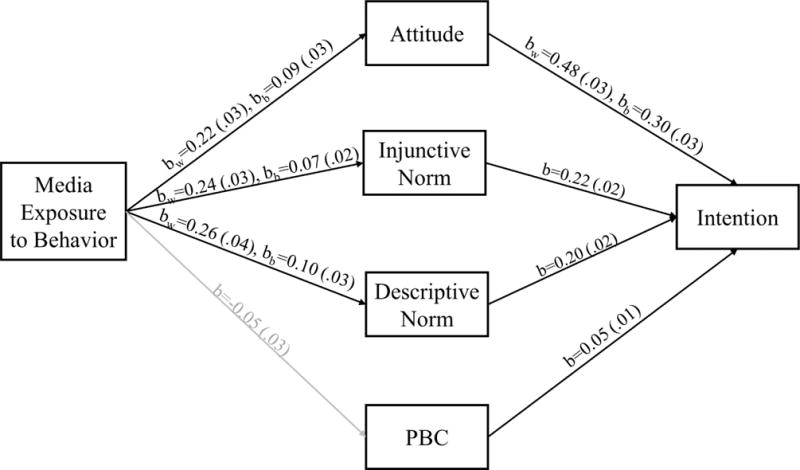
Figure 2. Path analysis results (n=1,990).

Note: greyed out path indicates pooled non-significant effect. Group coefficients presented when coefficients were significantly different between White and Black adolescents. Goodness of Fit: χ2(10)=62.8, p<.05, CFI=.99, TLI=.96, RMSEA=.042 (.030, .055). Correlations between error terms of mediating variables not shown for clarity.
