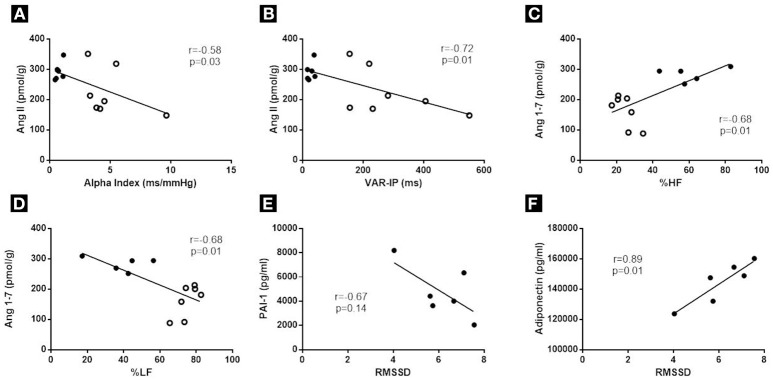
Figure 5.
Correlations between: (A) Alpha Index and cardiac Ang II; (B) VAR-IP and cardiac Ang II; (C) %HF and cardiac Ang 1–7; (D) %LF and cardiac Ang 1–7; (E) RMSSD and PAI-1; (F) RMSSD and Adiponectin. It was used between 5 and 7 animals per group. The correlations E and F were made using only the OB group. Open circles represent the WT group and closed circles represent the OB group.

