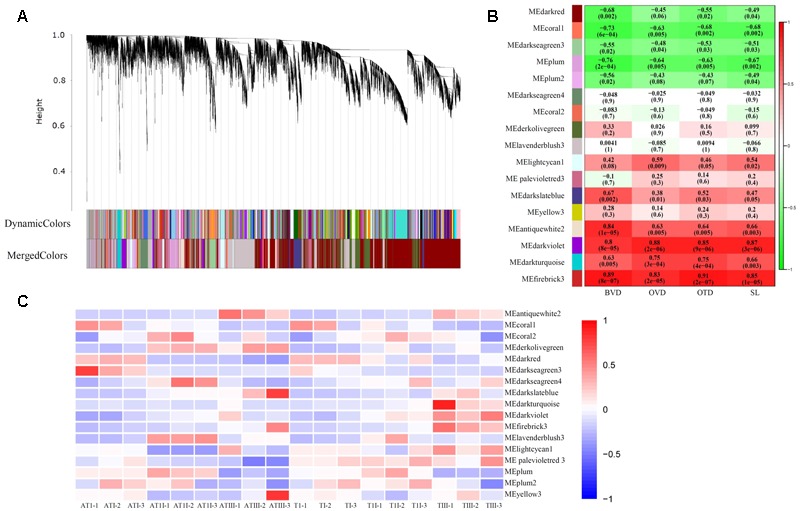
FIGURE 4.

Genes co-expression network analysis with WGCNA. (A) Hierarchical cluster tree of different co-expression modules. Each branch constitute one module, and each leaf in the branches represented one gene. A total of 17 distinct modules were labeled by different colors. (B) Module-trait association. Each row corresponds to a module. Each column amount to a trait. BVD, bud vertical diameter; OTD, ovary transverse diameter; OVD, ovary vertical diameter; SL, style length. The color at the right represented the size of correlation coefficient, the digital labels in the box in B stand for correlation coefficient (r) (upside) and test value (P-value) (bottom). Those modules with r > 0.6, P-value < 0.05 were selected to discuss. (C) Module-tissue association. Each row corresponds to a module. Each column amount to a tissue. The color of each box at the row/column intersection showed the size of correlation coefficient between the module and the tissue type. ATI, ATII, ATIII represented pistil of FMF when their BVD was 3.0–5.0, 5.1–13.0, and 13.1–25.0 mm. TI, TII, TIII represented pistil of BF when their BVD was 3.0–5.0, 5.1–13.0, and 13.1–25.0 mm.
