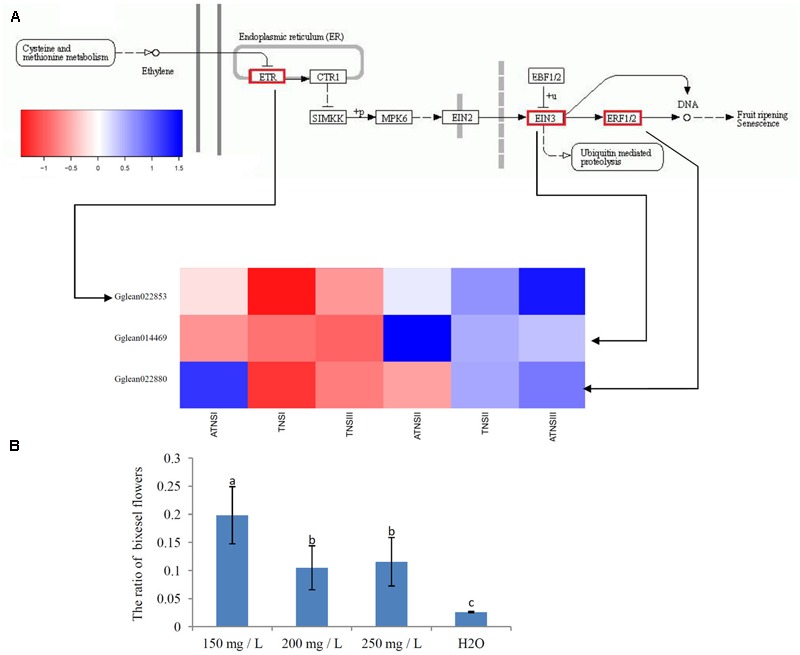
FIGURE 6.

Expression of candidate genes involved in ovule development. (A) Expression of candidate genes involved in ethylene signal transduction. Gene expression was measured by log2Ratio. ATNSI, ATNSII, ATNSIII represented pistil of FMF when their BVD was 3.0–5.0, 5.1–13.0, and 13.1–25.0 mm. TNSI, TNSII, TNSIII represented pistil of BF when their BVD was 3.0–5.0, 5.1–13.0, and 13.1–25.0 mm. Different colors from blue to red showed the size of correlation coefficient. (B) Effects of different concentrations of ethylene on the ratio of BF. mg/L stands for the concentrations of ethylene. Control sprayed by water. Different small letters indicate significant difference between treatments at P < 0.05 by Duncan’s new multiple range test. Error bar represented standard deviation.
