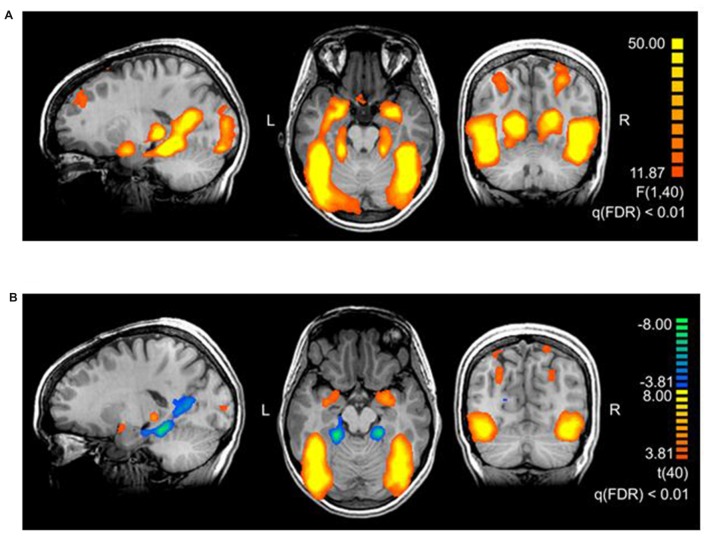
Figure 2.
(A) Brain areas activating stronger for threatening stimuli than for neutral stimuli. The map shows the main effect of threat, derived from a repeated measures 2 × 2 ANOVA with factors threat (levels: threatening, neutral) and origin (levels: evolutionary, modern). The thresholds in the figures are chosen for representational purposes, q(FDR) < 0.01. Talairach coordinates of slices x: 18, y: −56, z: −17. (B) Brain areas showing the differential effect of origin in threatening pictures. Contrast: (Evolutionary-threatening > Evolutionary-neutral) > (Modern-threatening > Modern-neutral), q(FDR) < 0.01. Talairach coordinates of slices x: −18, y: −66, z: −12.

