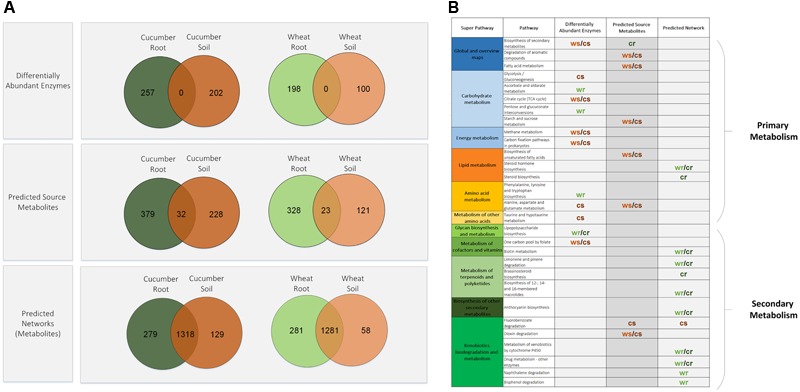
FIGURE 1.

Distribution patterns of differentially abundant enzymes, source-metabolites and network metabolites from the four experimental environments. (A) Venn diagrams of root versus soil entities. (B) Pathway significantly enriched with root versus soil entities. cr, cucumber root; cs, cucumber soil; wr, wheat root; ws, wheat soil.
