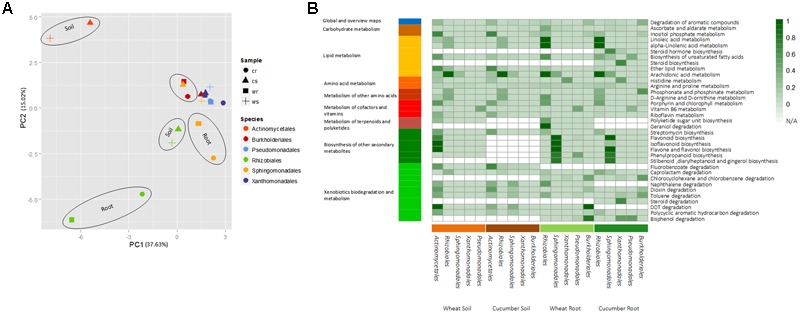
FIGURE 3.

The removal effect of enzymes dominated by key taxonomic groups on the metabolic potential of the community. (A) PCA analysis plot of the removal effect of taxonomic groups in different environments on the overall metabolic capacity of the corresponding communities. Vector profiles describe the absence/presence of metabolites in the absence/presence of the corresponding group. (B) Mapping of missing metabolites into specific pathways. Square color strength (white to dark green) denotes the degree of contribution of the taxonomic group to the denoted function, i.e., the fraction of missing metabolites following removal of the corresponding taxonomic groups out of all metabolites in the pathways without removal. White squares denote non-available data per function per sample indicating that the corresponding group was not one of the top key dominant groups in the corresponding sample. Only pathways with an effect score greater than 0.4 in at least a single experiment (removal iteration) are shown. The full removal description is available at Supplementary Tables S15–S18.
