Figure 2.

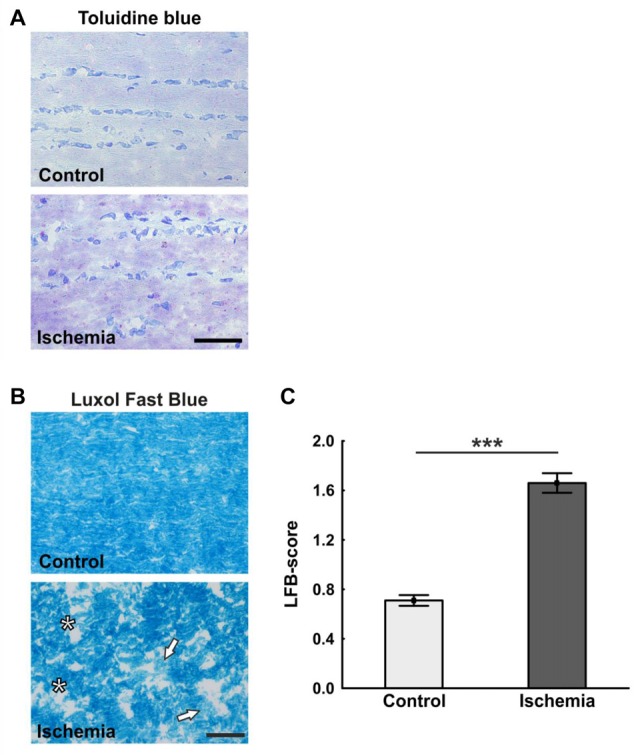
(A) Representative pictures of the toluidine blue staining. While in the control group a uniform coloring was present, various light areas were visible in the ischemia group. (B) Staining of longitudinal optic nerve sections with luxol fast blue (LFB). Comparable to toluidine blue staining, large bright areas were seen in the ischemic optic nerves. In contrast to this, the control optic nerves were uniformly colored. (C) The loss of myelin was valued based on a scoring system. Many areas of degeneration with subsequent loss of myelin and a dissolution of the tissue could be observed 21 days after ischemia induction. Arrows = demyelination area, asterisks = structure resolution. Scale bar: toluidine blue 50 μm, LFB 20 μm. ***p < 0.001.
