Figure 3.

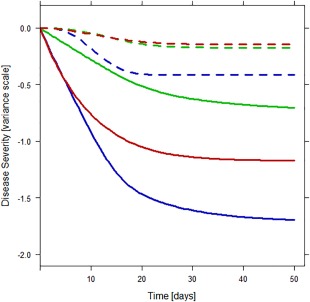
Longitudinal changes in disease state for typical individuals on placebo treatment (dotted lines) and paliperidone treatment (solid lines) for the positive (blue), negative (green), and general (red) subscale, according to our model.

Longitudinal changes in disease state for typical individuals on placebo treatment (dotted lines) and paliperidone treatment (solid lines) for the positive (blue), negative (green), and general (red) subscale, according to our model.