
Figure 4.
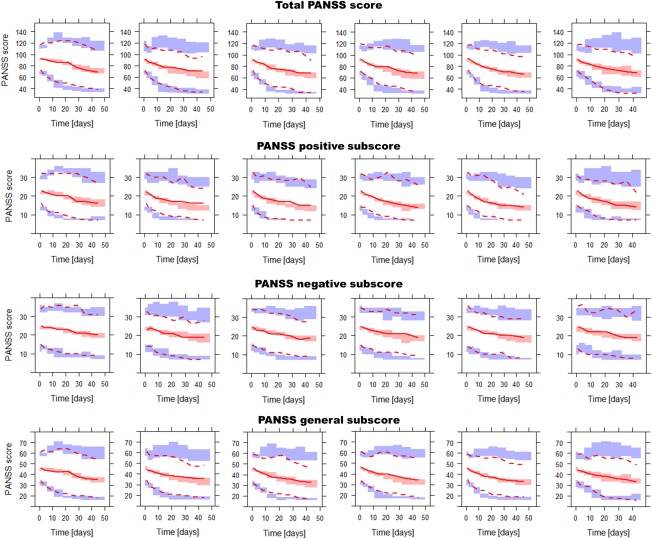
Visual predictive check in all treatment arms of the total PANSS score and the PANSS score on the three subscales. The lines represent 2.5th, 50th, and 97.5th percentiles of the observed data, the shaded areas represent the 95% confidence intervals of these percentiles based on 20 simulated datasets. From left to right, the columns show the results for the following daily paliperidone doses: 0 mg (placebo), 3 mg, 6 mg, 9 mg, 12 mg, and 15 mg.