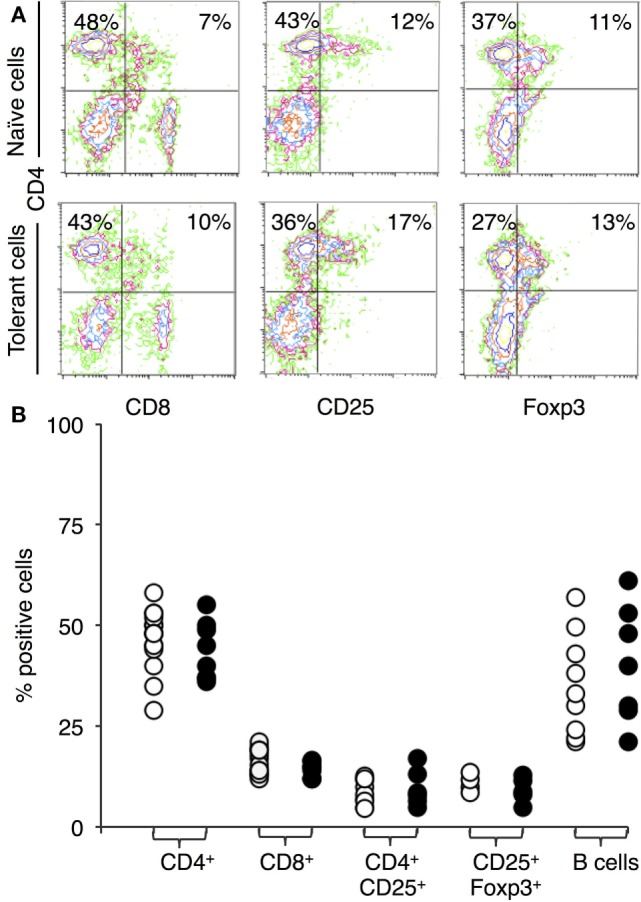
Figure 1.

Immunostaining of peripheral lymphocytes: comparison of cells from DA rats tolerant to a Piebald Virol Glaxo rat strain (PVG) allograft and naïve DA. (A) FACS profiles of lymphocytes from naïve DA rats (upper panel) and DA rats tolerant to PVG heart graft (lower panel). y-axis represents CD4 and x-axis CD8 (left panel), CD25 (middle panel), and forkhead box P3 (FOXP3) (right panel). (B) Percentage of cells expressing a given cell surface molecule in naïve (○) and tolerant (●) animals, results from 4–16 different sets of animals. There was no significant difference in the proportion of CD4+ or CD8+ T cells showing anti-CD3 therapy did not deplete T cells. There was no increase in B cells with tolerance. The proportion of CD4+CD25+ T cells or CD25+FOXP3+ T cells was not increased in tolerant animals.
