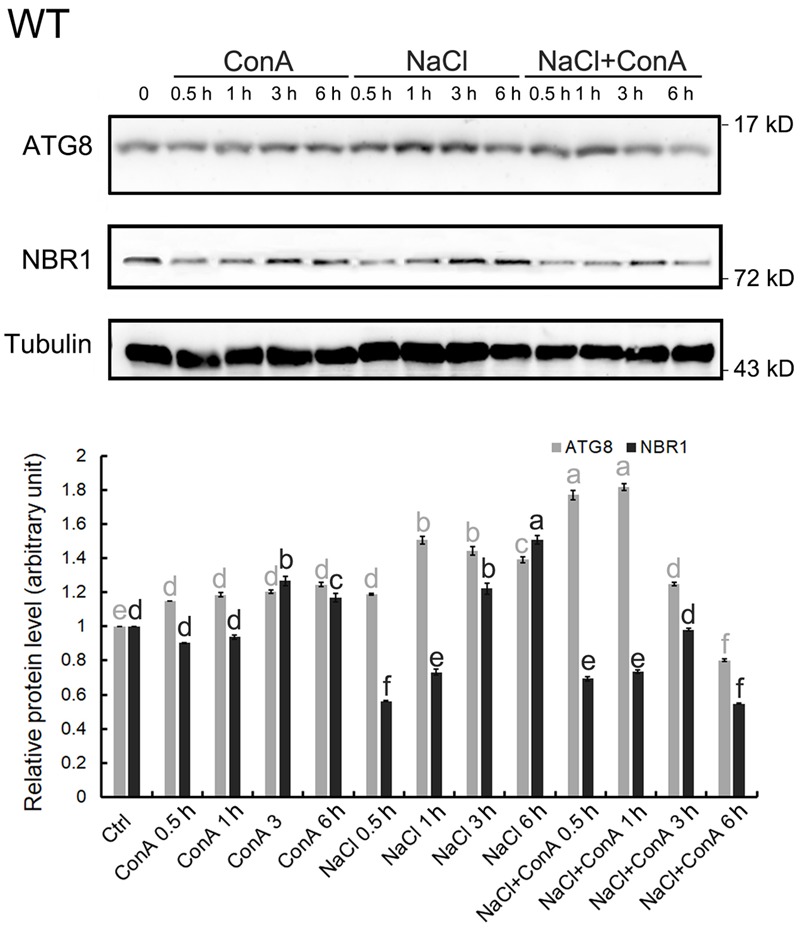
FIGURE 2.

Autophagy is induced within 30 min of salt stress in the wild-type seedlings. The level of autophagy is represented by the difference in ATG8 protein levels between Concanamycin A (ConA)-treated and untreated samples at the same time points. In 150 mM NaCl-treated wild-type (WT) seedlings, induced autophagy can be observed mainly from 0.5 to 1 h upon stress. Selective autophagy, represented by differences in the amount of NBR1 in ConA+/-samples, can also be observed at 0.5 h. All SDS-PAGE gels contained 6 M urea. Anti-Tubulin antisera were used as internal control. Band intensity was quantified in Image J and normalized twice; firstly to Tubulin of the same time points, then to the controlled condition (time point 0), which was set as 1. Statistical analysis was performed by Tukey’s test. Columns labeled with the same letter are not significantly different (p ≤ 0.01). Bar = standard error.
