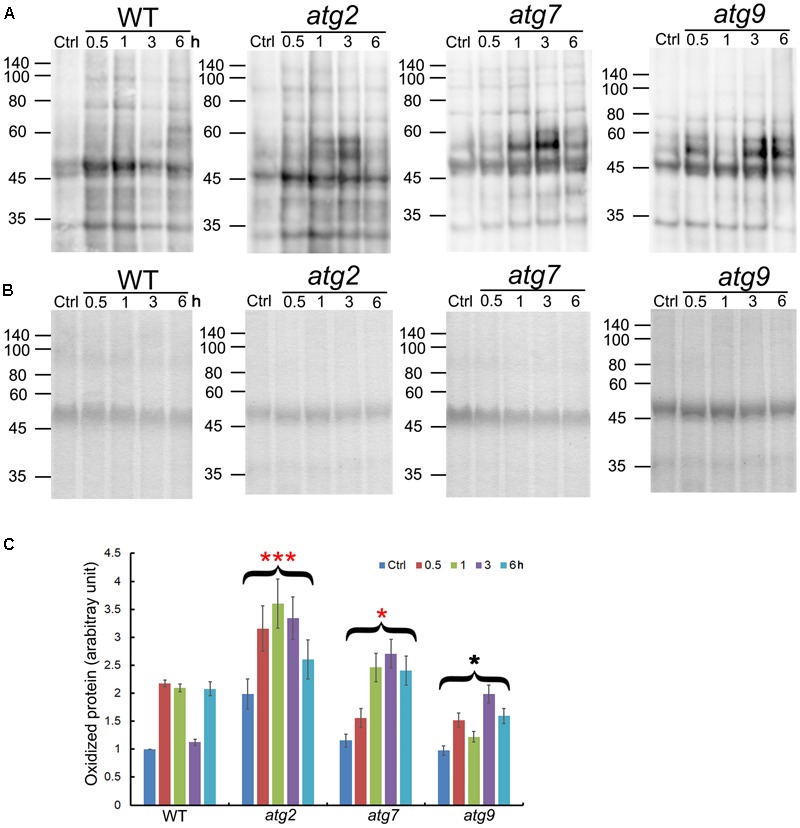
FIGURE 3.

Quantification of oxidized proteins in WT and the autophagy mutants. (A) Ten-day-old WT, atg2, atg7, and atg9 seedlings were transferred to liquid 1/2 MS containing 150 mM NaCl for the indicated time. Total proteins extracted were then derivatized by DNP, followed by immunoblotting with anti-DNP antibodies. Molecular mass (kDa) are indicated at the left. (B) Coomassie Blue staining of total proteins (before derivatization with DNP) as the loading control. Molecular mass (kDa) are indicated at the left. (C) DNP signals were quantified by densitometry from three independent repeats with the WT control value set as 1; ∗∗∗p < 0.001, ∗p < 0.05. Bar = standard error.
