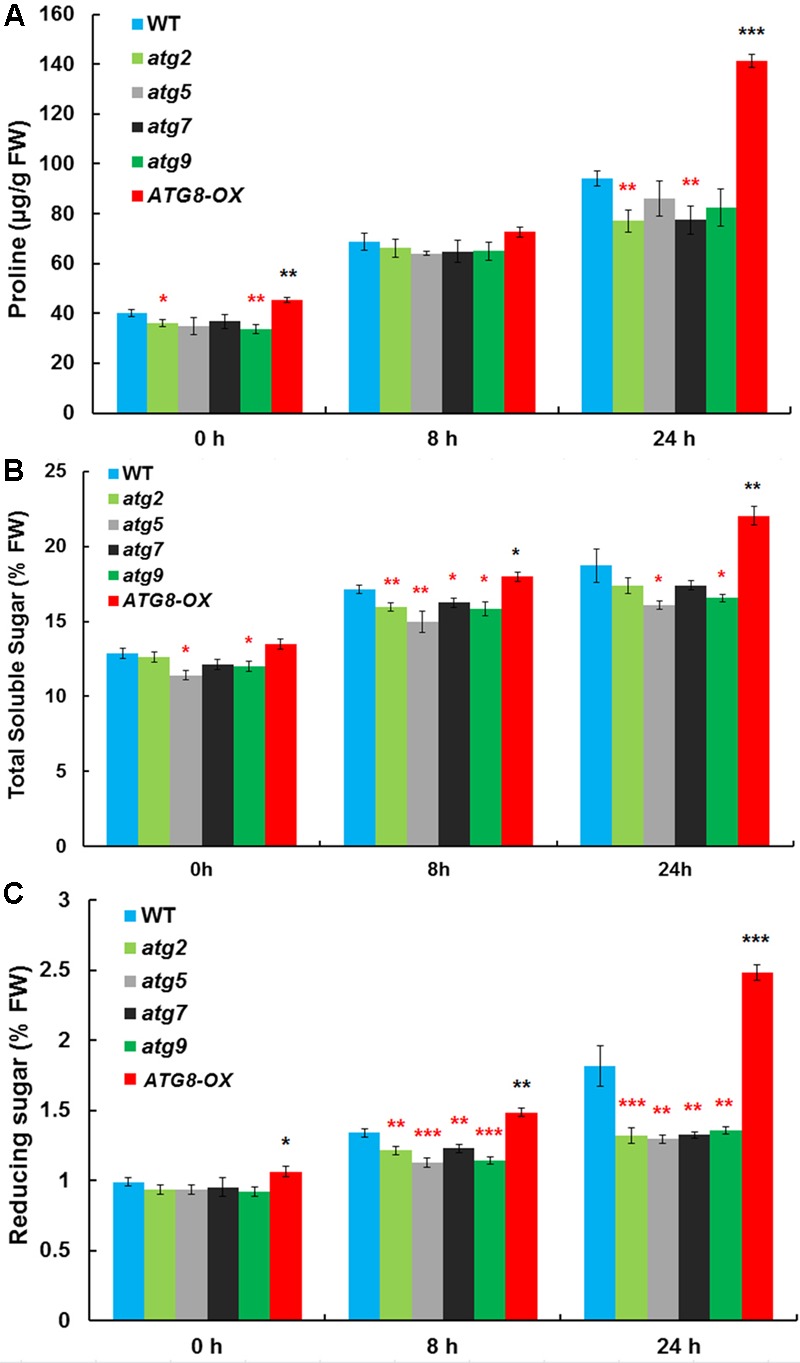
FIGURE 5.

The autophagy mutants accumulate less compatible osmolytes upon salt stress. (A) Proline contents; (B) total soluble sugar contents; (C) reducing sugar contents in atg2, atg5, atg7, and atg9, along with the wild-type and Pro35S:GmATG8c (ATG8-OX) following 150 mM NaCl treatment. ∗p < 0.05, ∗∗p < 0.01, ∗∗∗p < 0.001, respectively. Red star = lower than WT; black star = higher than WT at the same time point. Averaged results from three biological replicates, each consisting of four technical repeats, are shown. Bar = standard error in (A–C).
