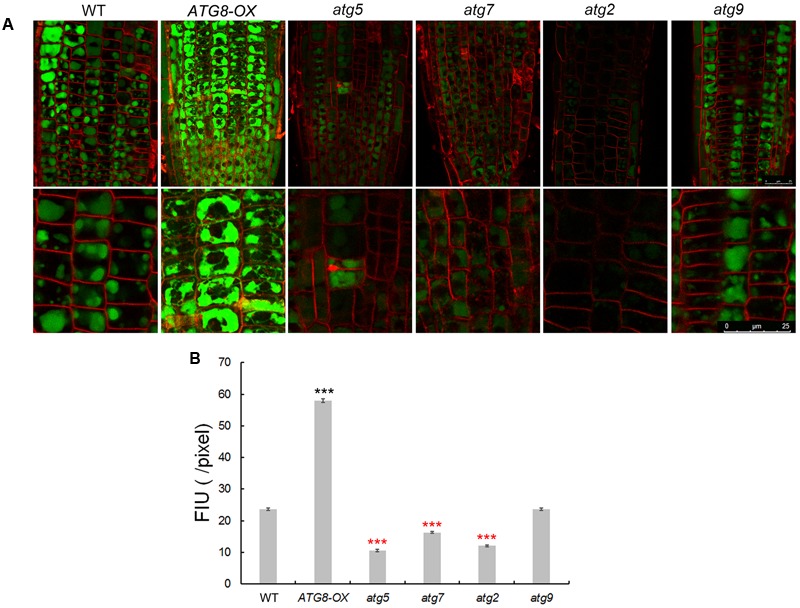
FIGURE 7.

Imaging of Na+ in seedling roots of WT, autophagy mutants, and ATG8-OX. (A) Roots of 5-day-old wild-type, atg5, atg7, atg2, atg9, and ATG8-OX seedlings were incubated in liquid 1/2 MS containing 100 mM NaCl for 6 h, stained with CoroNa Green AM (5 μM) in the presence of 100 mM NaCl for 2 h, and scanned with a confocal microscope. The root tip region is shown (upper panel). Cortex cells in the meristematic region are 2.5× magnified (lower panel). Plasma membrane was stained with FM4-64 before scanning. (B) Quantification of CoroNa Green AM fluorescent intensity in (A). More than 30 cells from more than 20 roots (three biological replicates), were quantified. Bar = 25 μm in (A). ∗∗∗p < 0.001. Red star = lower than WT; black star = higher than WT in (B).
