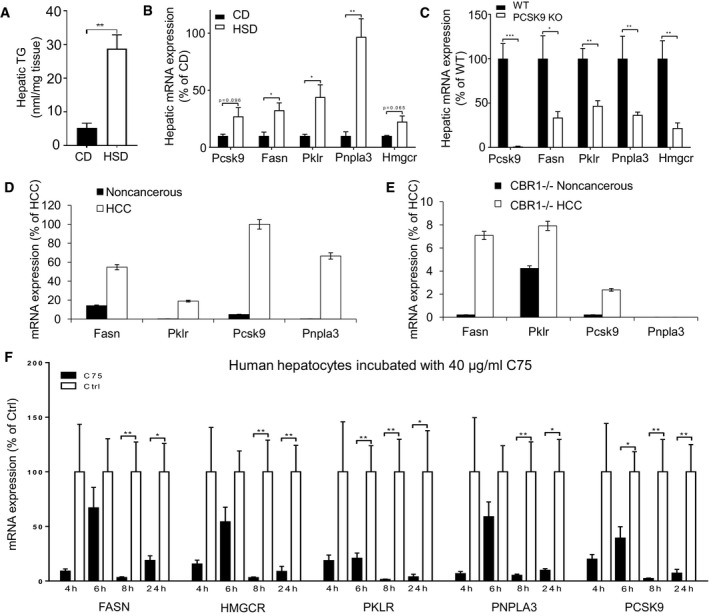
Figure 5. The relationship between the genes in mice and human samples.

-
ATG content in the liver tissue of mice fed a zero‐fat high‐sucrose diet (HSD) and chow diet (CD) for 2 weeks (n = 10).
-
B–FThe hepatic mRNA expressions of the Fasn, Pklr, Pcsk9, Pnpla3, and Hmgcr is measured in (B) mice fed a HSD and CD for 2 weeks, (C) Pcsk9 knockout and its littermates (WT) fed a CD for 10 weeks, (D) wild‐type HCC tumor and noncancerous samples, (E) CB1R knockout HCC tumor and noncancerous samples, and (F) primary human hepatocytes treated with C75 for 4, 6, 8, and 24 h.
