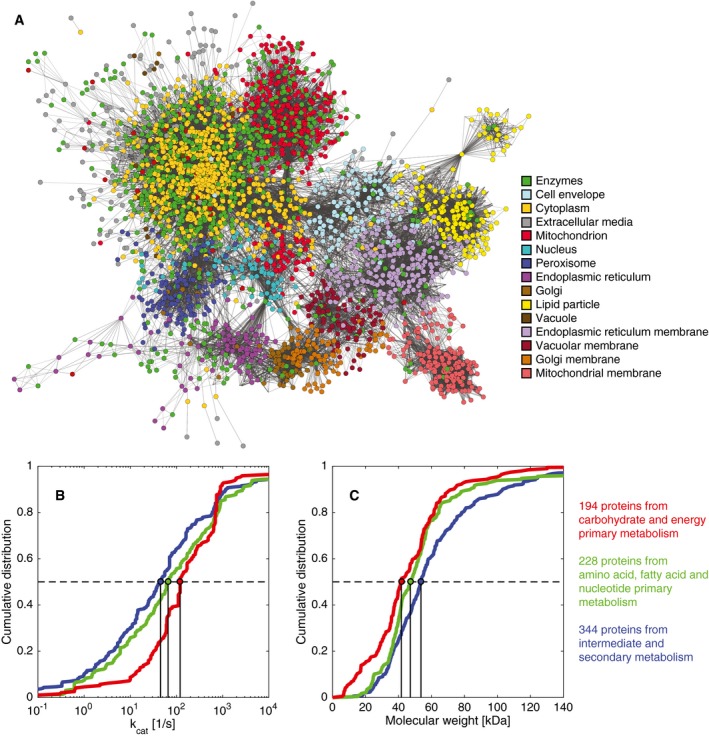
Figure 2. Visualization of the Saccharomyces cerevisiae model expanded to account for enzymes.

-
ANetwork with metabolites and enzymes, color‐coded to show the location of enzymes (green dots) and metabolites (color‐coded by compartment).
-
B, CCumulative distributions of (B) k cat values and (C) molecular weights for three different metabolic groups. All distributions were significantly different with P < 0.05 using a non‐parametric Wilcoxon rank‐sum test (Appendix Table S4).
