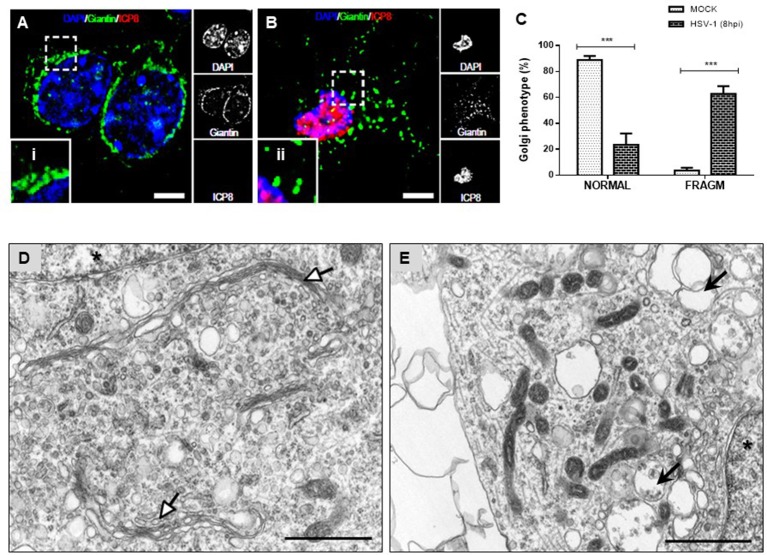
Figure 3.
Morphological disruption of the GA during HSV-1 neuronal infection. Cortical primary neurons were either mock-infected (A; MOCK) or HSV-1 infected (B). After 8 h post-infection cells were fixed, permeabilized, and immunostained for Giantin (Golgi marker protein, green) and ICP8 (viral infection marker, red). Nuclei were visualized with DAPI. (A,B) Show the corresponding merged images. Regions of interest taken from the merged images (left box) are presented at high magnification to show (i) normal distribution of Giantin marker (concentrated in the perinuclear region) and (ii) fragmented distribution (dispersed throughout the cytoplasm). Scale bar, 5 μm. (C) Scoring of Golgi morphologies (distribution pattern of Giantin) in mock- and HSV-1-infected neurons at 8 hpi. Golgi phenotypes in these cells were categorized as normal reticular-perinuclear signal (NORMAL) or displaying fragmentation/vesiculation of the Golgi compartment (FRAGM). Neuronal morphology was visualized with the specific neurites marker MAP-2 as shown in Figure S1. Bars represent the mean ± SD of three independent experiments. ***p < 0.001 compare to the MOCK. Brackets display a comparison between infected and mock-infected neurons. Representative electron micrographs of Golgi stacks in mock-infected neurons (D) and in HSV-1 infected neurons at 8 hpi (E). Organized Golgi stacks are indicated in mock-infected neurons (white arrowheads), structures that are absent in HSV-1-infected cells, which displayed discontinued stacks and dilated-elongated Golgi cisternae (black arrowheads). Asterisk indicate nucleus. Scale bar, 1 μm.

