. 2017 Sep;112(9):617–625. doi: 10.1590/0074-02760160522

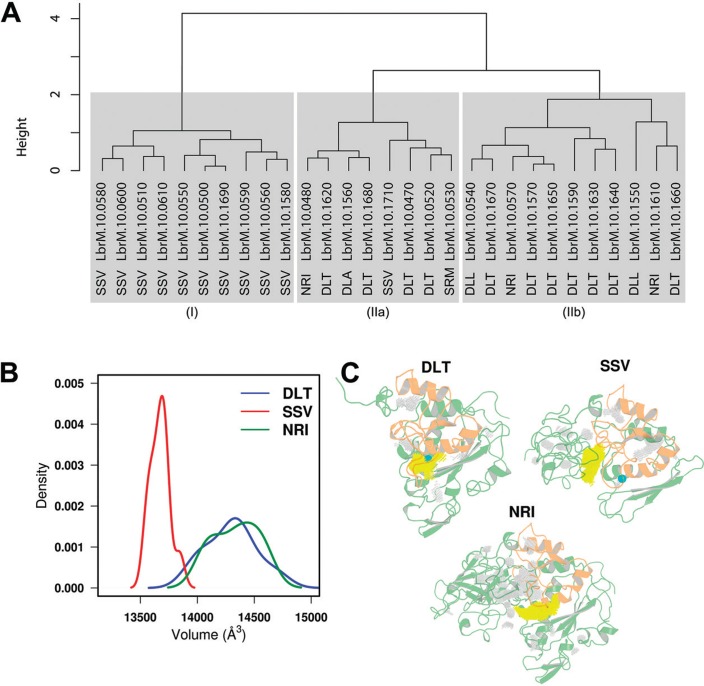
Fig. 5. : (A) structure dendogram of the M8 metalloprotease family of Leishmania (Viannia) braziliensis. The scale on the left represents the height based on the Euclidean distance of standardised variables. Gray blocks highlight the formation of (I), (IIa) and (IIb) groups. The motif which identifies the structure is near the sequence name. (B) Distribution of the insertion region volumes calculated for each representative structure from distinct subgroups. Coloured as indicated in the legend. (C) Binding cavity analysis of the representative structures from the DLT, NRI and SSV subgroups. The insertion region is shown in orange while the largest cavity is highlighted in yellow. The catalytic zinc ion is represented as a cyan CPK sphere.

Fig. 5