Fig. 4.

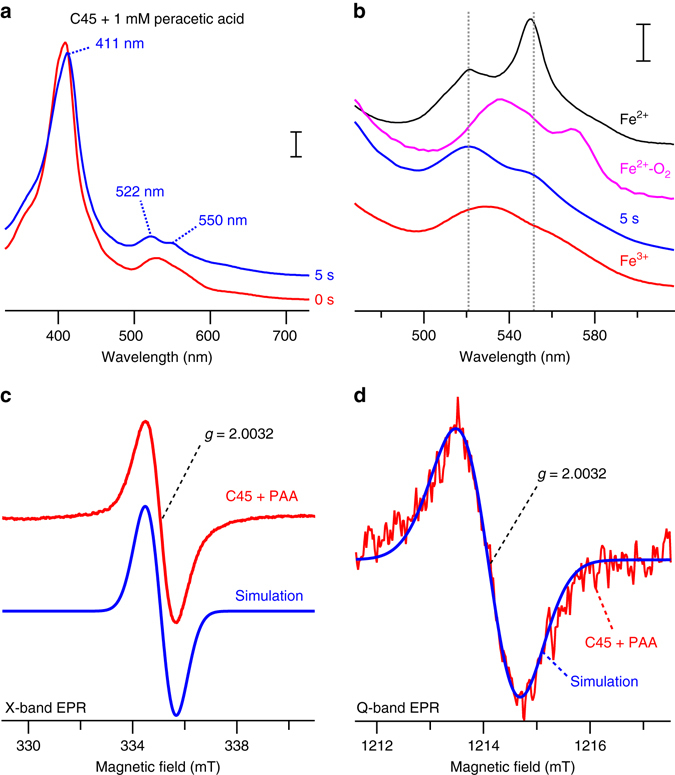
Isolation of high-valent oxo-iron species in a CTM. a, b UV/visible spectra of ferric C45 (red) and peracetic acid-treated C45 (blue) obtained by rapid mixing experiments in a stopped-flow spectrophotometer. Ferrous (black), Ferric (red), and oxyferrous C45 (magenta) spectra are displayed for comparison. The putative C45 compound I species in a, b were generated by mixing 2 mM peracetic acid with 20 μM ferric C45 in 100 mM KCl, 20 mM CHES, pH 8.58. Scale bars represent optical densities of 0.05 (a) and 0.02 (b). c X-band cw-EPR spectrum of C45 mixed with peracetic acid (red) indicates the formation of a radical species with g = 2.0032. Simulated data of a tryptophan radical species within C45 are presented in blue. Spectra were obtained by mixing 1 mM peracetic acid with C45 (700 μM) in 100 mM KCl, 20 mM CHES, pH 8.58. Experimental conditions: EPR microwave frequency = 9.3933 GHz, microwave power = 1 mW, modulation amplitude = 0.3 mT, temperature = 12 K. d Q-band cw-EPR spectrum of C45 mixed with peracetic acid (red, conditions as for the X-band EPR data) and simulated data of a tryptophan radical species in C45 are presented in blue. The lack of observable g-anisotropy of the radical signal indicates the presence of an amino acid side chain-based radical species. Experimental conditions: EPR microwave frequency = 34.027 GHz, microwave power = 3 μW, modulation amplitude = 0.3 mT, temperature = 50 K
