
Fig. 4.
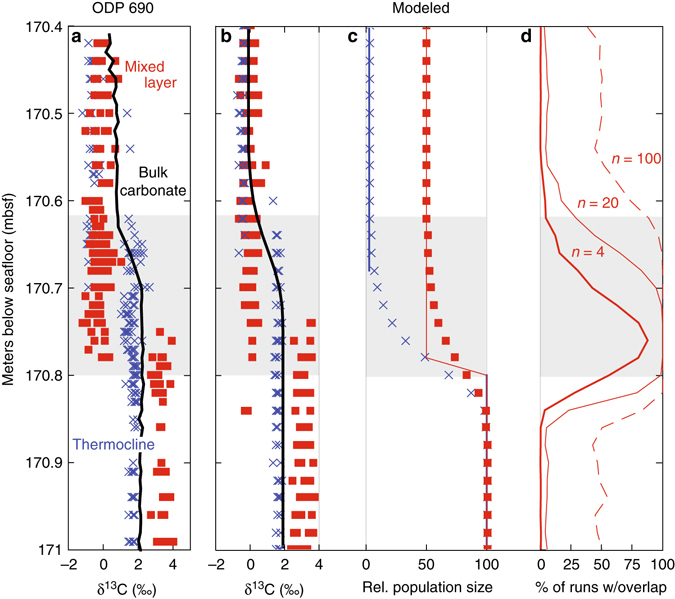
Sediment-mixing model including unequal changes in abundance across mixed-layer and thermocline species can explain patterns in ODP Site 690 data. a Single-foraminifera isotope data from ODP Site 690 across the PETM from mixed-layer planktonic foraminifera δ13C (red), thermocline δ13C (blue), and from bulk carbonate δ13C (black) (values from ref. 8). b Sediment model simulation of δ13C in mixed-layer (red), thermocline (blue), and bulk carbonate (black) assuming a greater change in the abundance of thermocline species and in the nannoplankton taxa comprising the majority of the bulk carbonate than in mixed-layer species, with abundance changes indicated in panel c where lines = pre-mixing abundance and symbols = post-mixing abundance. The modeled onset of the CIE in the unmixed record occurs in all groups simultaneously at 170.8 mbsf—it is the combination of bioturbation and unequal abundance change that makes the δ13C change appear diachronous. d Despite bioturbation, most samples record just pre-event or CIE-type isotopic values when only small sample sizes (n = 4 individuals) are selected from the model record. Gray box highlights the interval in ODP Site 690 data showing the apparent delay in isotopic change between mixed layer and thermocline individuals