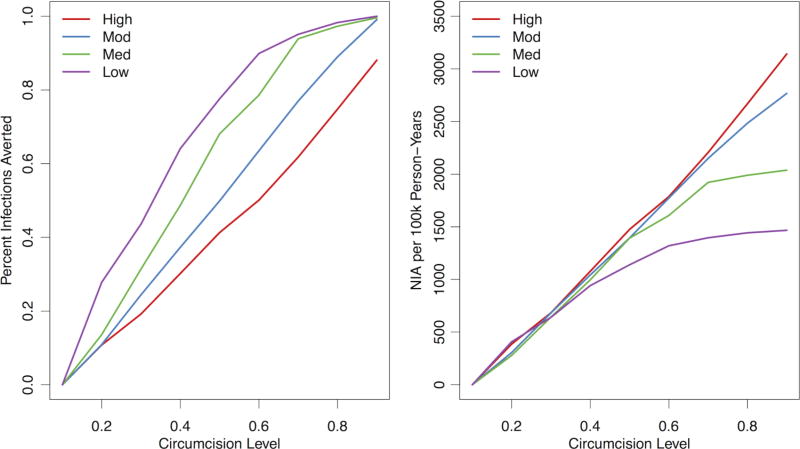
Figure 2.
Estimated per cent of infections averted (left panel) and number of infections averted (NIA) (right panel) comparing levels of circumcision prevalence to lowest simulated value (10%), across the four concurrency levels. Concurrency categories: High (observed)=17.8% for men and 2.8% for women; Moderate (75% of observed)=13.4% for men and 2.1% for women; Medium (50% of observed)=8.9% for men and 1.4% for women; and Low (25% of observed)=3.3% for men and 0.5% for women. The per cent of infections averted is 1—the incidence rate ratio comparing the HIV-1 incidence in each circumcision level of circumcision relative to the 10% scenario. The number of infections averted is expressed in terms of 100 000 person-years at risk of observation time, compared with the starting value in the 10% circumcision scenario.

