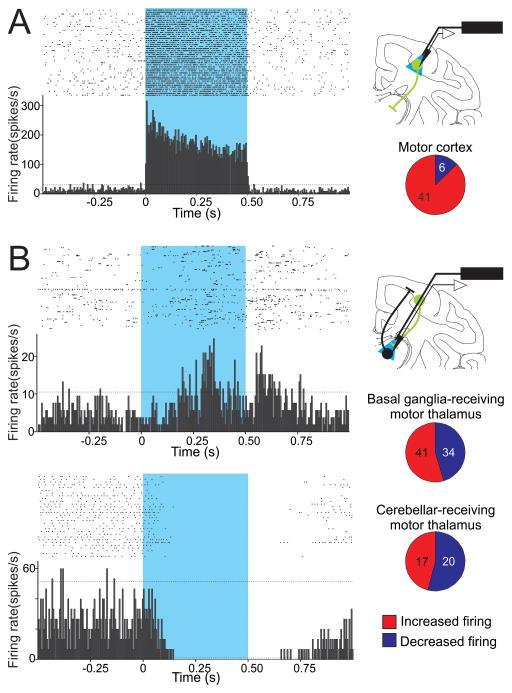
Figure 1.
Effects of optogenetic stimulation of neurons in motor cortices and cortico-thalamic terminals in motor thalamus. A. Responses of cortical neurons to opsin activation. Left: Raster diagram and peri-stimulus time histogram (PSTH) of a single neuron in primary motor cortex, showing increased firing in responses to 500 ms light pulses. B. Responses of thalamic neurons to activation of opsins on corticothalamic axons. Top: Raster diagram and PSTH of a neuron in the basal ganglia-receiving territory of the motor thalamus that showed an increase in firing during the activation of ChR2. Bottom: A neuron in the cerebellar-receiving motor thalamus showing a decrease in firing during the activation of ChR2. For A and B, raster diagrams and PSTHs are aligned to the start of light pulses, each bin in the PSTH is 5 ms in duration; dashed horizontal lines indicate 2 SD above and below the baseline (based on the firing of the neuron during the 0.5 s prior to the start of each stimulus). The blue rectangles indicate the light pulses. At right: Experimental configuration to activate opsins expressed at the level of somas (top) or terminals (bottom) on cortico-thalamic neurons (green), with simultaneous extracellular recordings of cortical or thalamic neurons (top and bottom, respectively). Pie graphs represent the proportion of neurons in motor regions of cortex and thalamus that increased or decreased firing in response to the light stimulation. Numbers of cases are indicated (figure modified with permission from from Galvan et al. 2016).

