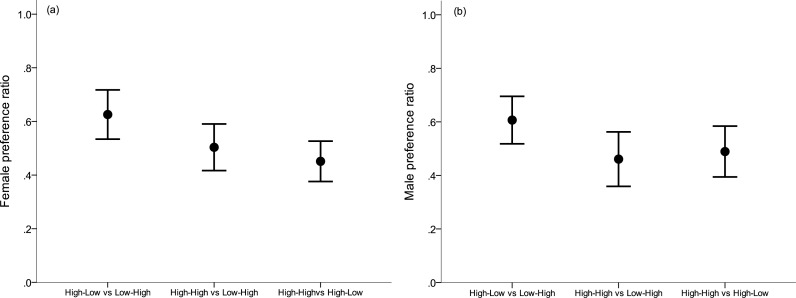
Figure 2. Preference ratios.
(A) Female and (B) male preference ratio for males from the better nutritional conditions, respectively (mean ± s.e.). A preference ratio of 0.5 indicates equal amount of time spent at either opposite sex individual. Early nutritional treatment groups in which subjects were raised during their first month post hatching: LH (lower quality food as nestling-higher quality food as fledgling), HL (higher–lower) and HH (higher–higher).

