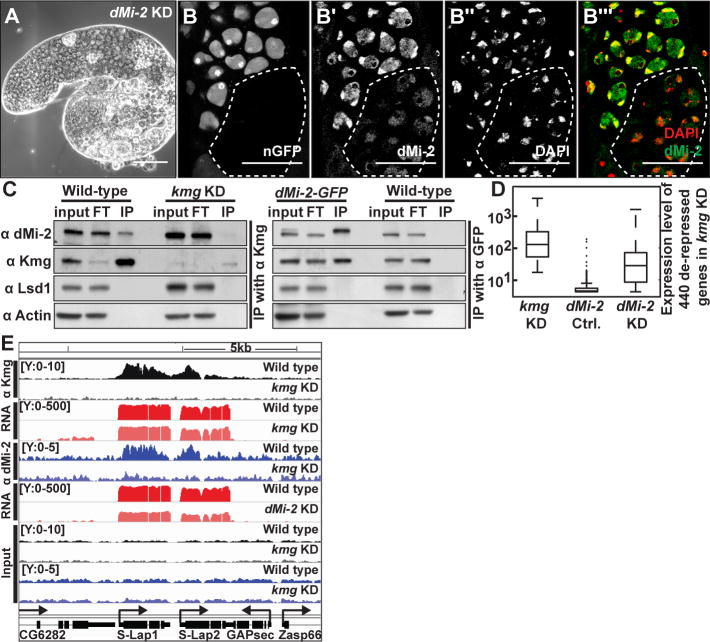
Figure 3. Kmg recruits dMi-2 to actively transcribed genes in spermatocytes.
(A) Phase-contrast image of a dMi-2 KD testis.
(B-B‴) Immunofluorescence images of (B) GFP visualized by native fluorescence, (B′) dMi-2, (B″) DAPI, (B‴, merge) DAPI (red), dMi-2 (green) in testis bearing germ line clones homozygous mutant for kmg (dotted line), marked by absence of GFP.
(C) Western blot of dMi-2, Kmg, Lysine Specific Demethylase 1 (Lsd1), and Actin after immunoprecipitation of (left) Kmg from wild-type and kmg KD or (right) GFP from dMi-2-GFP and wild-type testis lysates. Input: (Kmg IP) 15% or (dMi-2-GFP IP) 7.5% of lysate, FT: flow through after immunoprecipitation (equal proportion as input), IP: complete eluate after immunoprecipitation. Note: two bands in input lane from dMi-2-GFP testes, which express both dMi-2-GFP and untagged dMi-2.
(D) Box plot of expression of 440 de-repressed somatic transcripts in kmg KD, dMi-2 sibling control (no Gal4 driver) and dMi-2 KD testes. (whiskers) the most extreme data points excluding outliers.
(E) Genome browser screenshot showing ChIP-Seq results for Kmg and dMi-2. Y-axes: normalized read counts based on total one million mapped reads per sample. Y-axes for RNA-Seq reads are in log scale.
Scale bars: 100μm in A; 50μm in B-B‴.

