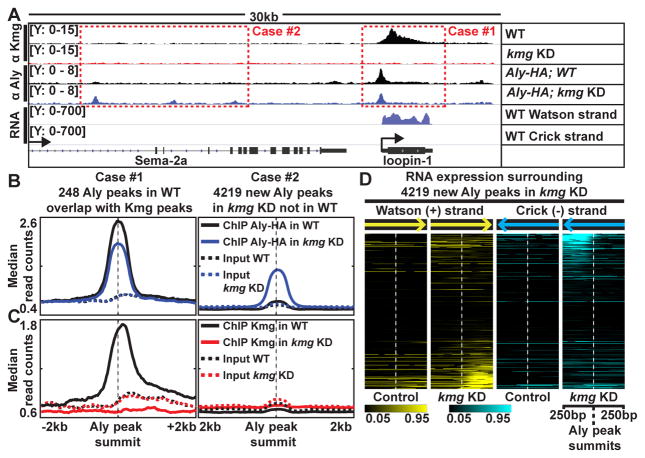
Figure 6. Kmg prevents promiscuous activity of Aly.
(A) Genome browser screenshot showing ChIP-Seq results for Kmg and Aly in control and kmg KD testes and RNA-Seq results from wild-type testes. Y-axes: normalized read counts based on one million mapped reads per sample.
(B and C) Median profile of (B) Aly and (C) Kmg ChIP (solid lines) and corresponding input (dotted lines) signals centered around (Case #1, left) Aly peaks identified in wild-type testes (q < 10−10 and identified in both replicates) that overlap with Kmg peaks and (Case #2, right) new Aly peaks identified in kmg KD testes (q < 10−10 and identified in both replicates) that were not detected in wild-type testes. For the 248 Aly peaks in the Case #1 - because these peaks were present at the promoters of genes with known strand information, read counts were plotted according to the direction of transcription from 5′ to 3′.
(D) Heatmap representation of normalized RNA-seq read counts centered around 4,219 new Aly peaks that appeared in kmg KD (Case #2). Darkest (black) color: read count value at the 5th percentile. Brightest (yellow for reads mapped to Watson (+), cyan for Crick (−) strands) colors: values at the 95th percentile among all values in kmg KD.

