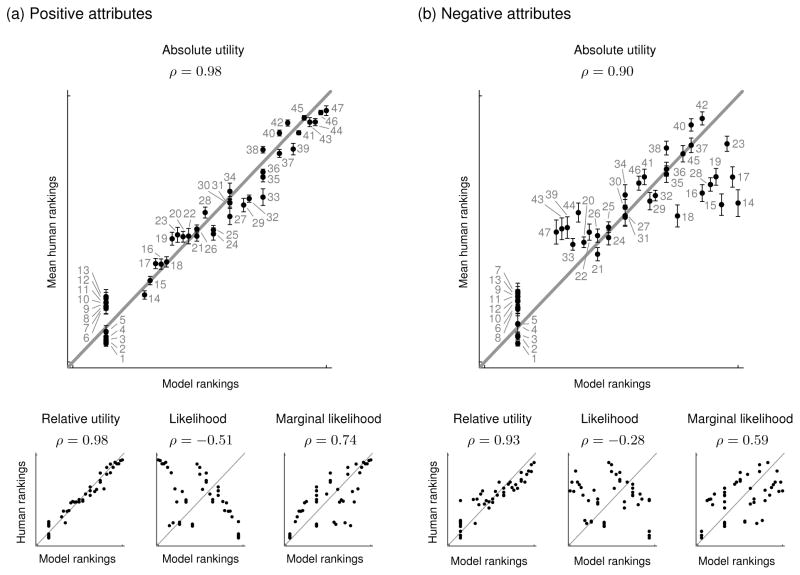
Figure 3.
Experiment 1 results. The plots show mean human and model rankings of the choices in Figure 2 from weakest evidence to strongest evidence of a preference for X for (a) positive attributes and (b) negative attributes. Error bars indicate standard errors and the number labels refer to the choices in Figure 2. The diagonal lines indicate perfect correspondence between model rankings and mean human rankings. The ρs are Spearman rank correlation coefficients.

