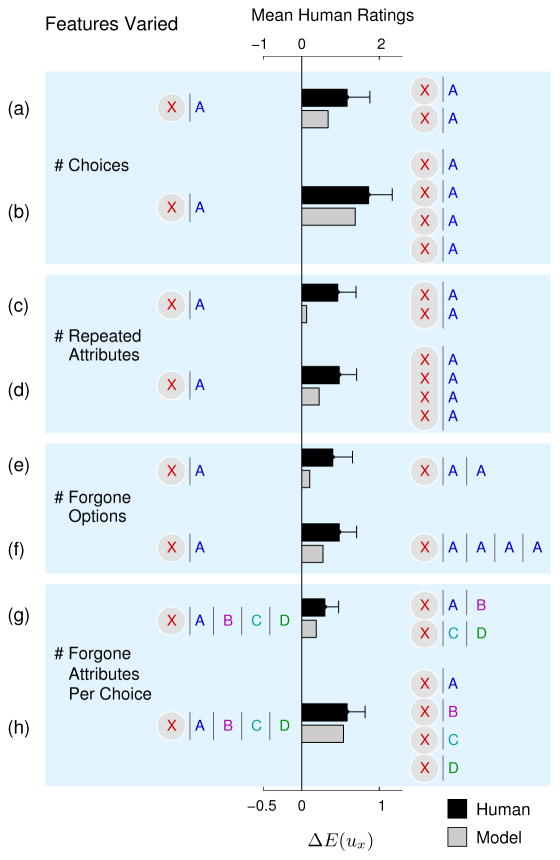
Figure 7.
Experiment 3 results. The bars show mean human ratings and inverse decision-making model predictions for the pairs of observed choices in each row. The bars point toward the choice that provides stronger evidence of a preference for X. Error bars indicate 95% confidence intervals. Predictions for the maximizing model (not shown) are 0 for every comparison.

