Figure 3.

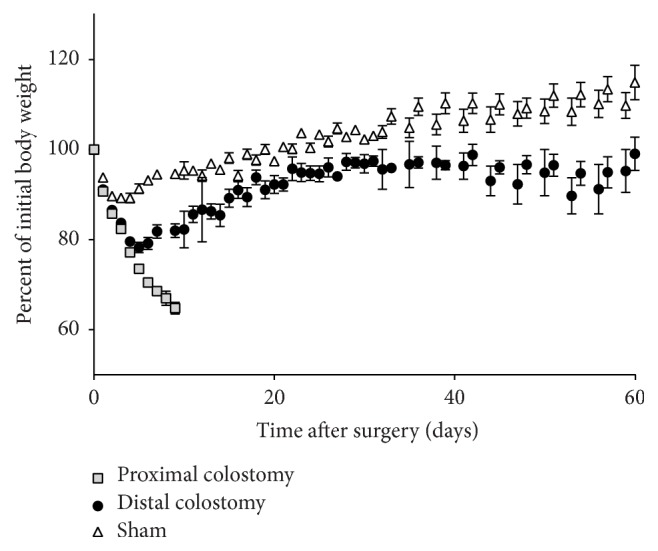
Body weight development. Body weight was measured daily. The body weight is shown as percentage of the preoperative body weight. Values are mean ± standard error of the mean of 21–35 animals per group (PC n = 35; DC n = 21; sham n = 26).

Body weight development. Body weight was measured daily. The body weight is shown as percentage of the preoperative body weight. Values are mean ± standard error of the mean of 21–35 animals per group (PC n = 35; DC n = 21; sham n = 26).