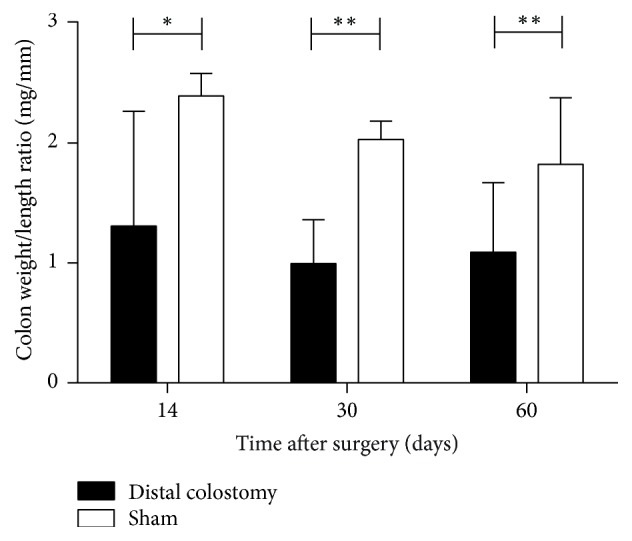
Figure 5.

Colon weight/length ratio. In the DC group, there was a significant decrease of the CW/L ratio compared to sham at all investigated time points (∗p < 0.05; ∗∗p < 0.01). Values are median with interquartile range of 5–9 animals per group (DC 14 and 30 days, sham 14 days: n = 8; DC 60 days: n = 5; sham 30 and 60 days: n = 9).
