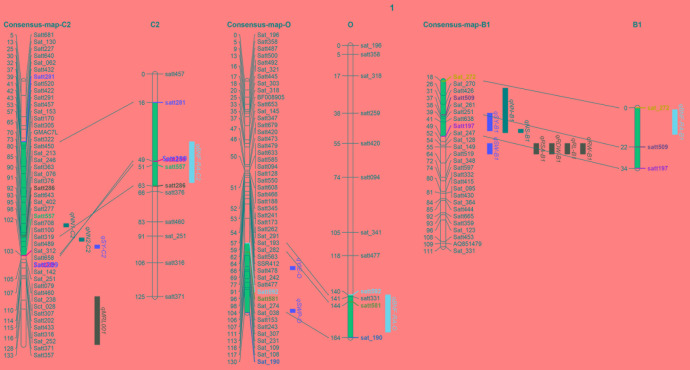
FIGURE 4.
Co-location analysis using three QTL clusters (pink) detected here, along with previously identified QTLs for yield (red), BNF (black) and RA (green) traits. Previously reported QTLs and references are showed as follows: qSY-C2 (Kabelka et al., 2004), qYIE- O (Wang et al., 2014), qSWP-O (Liu et al., 2011), qSW-B1 (Liang et al., 2010) and qSY-B1 (Du et al., 2009) for yield and SDW; qNN1-C2 (Hwang et al., 2014), qNN2-C2 (Hwang et al., 2014), qNN-B1 (Santos et al., 2013) and qNS-B1 (Hwang et al., 2014) for BNF traits; qRSA-B1, qRDW-B1, qRL-B1, and qRW-B1 for RA traits (Liang et al., 2010). Projected regions are highlighted in dark blue. Markers in different colors indicate the corresponding markers on LGs and in projection regions.

