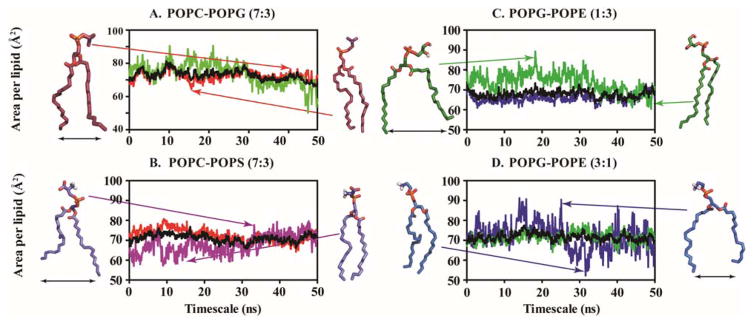
Figure 1.
Area per lipid is estimated for heterogeneous bilayer systems. The average value (black line) is also plotted against simulation time. (A) POPC/POPG 7:3, (B) POPC/POPS 7:3, (C) POPG/POPE 1:3 and (D) POPG/POPE 3:1. POPC, POPS, POPG and POPE are represented by red, purple, green and blue colour, respectively.

