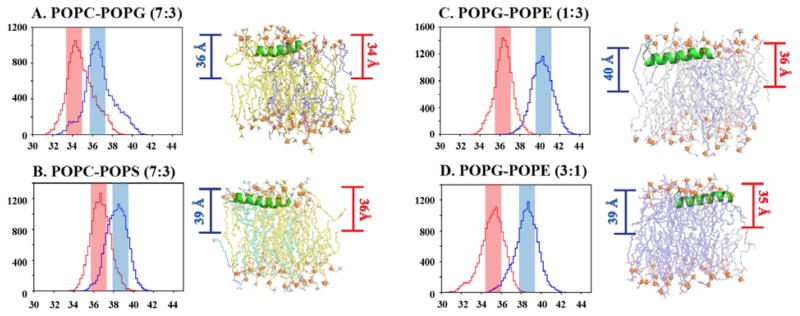
Figure 4.
The maximum number of MSI-594 configurations present at a particular distance from the center of bilayer is plotted by histogram analysis and representative snapshots are given from simulation trajectory for (A) POPC/POPG 7:3, (B) POPC/POPS 7:3, (C) POPG/POPE 1:3 and (D) POPG/POPE 3:1 bilayer systems. [Blue represents the distance between center of bilayer and the residue with maximum bend angle; Red represents the distance between center of bilayer and Gly12 residue.]

