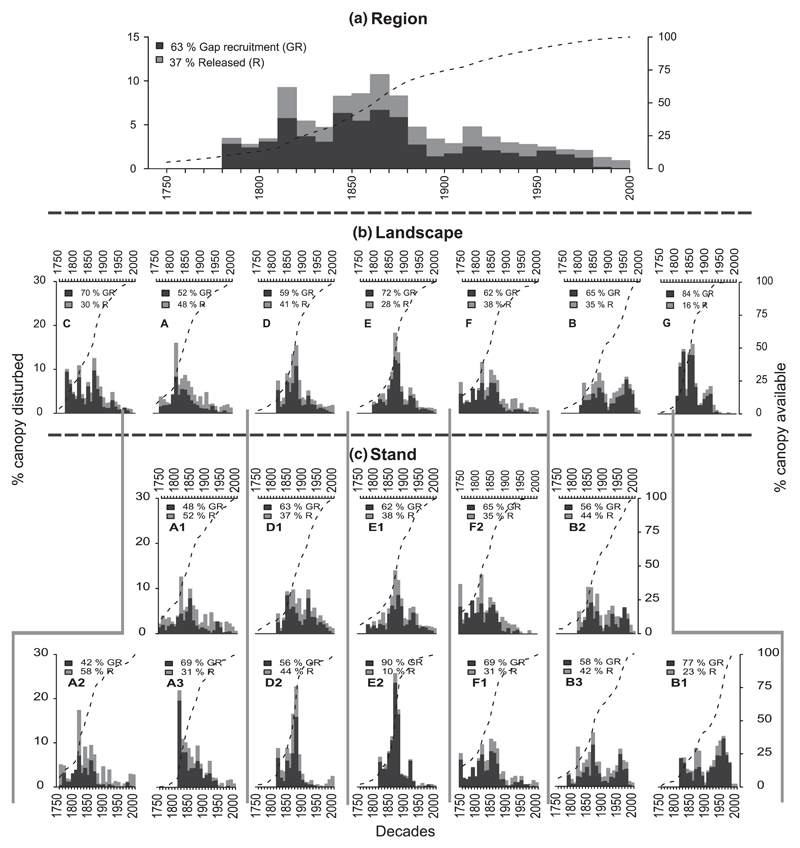
Fig. 1.
Hierarchical scheme of percent canopy disturbed for the Western Carpathian region (all plots pooled) (a), the landscape scale (b), and the stand scale (c). Disturbance chronologies were derived from analyzing two types of events indicating disturbance – gap recruitment and growth release. The percentage of these two types as well as abbreviations identifying the respective stands and landscapes (cf. Table 1) are placed in the top left corner of each panel. All disturbance events in a decade were summed, and the chronologies were truncated when the percentage of canopy available (dashed black line; secondary y axis) fell below 10% of the total number of samples. The percentage of canopy available represents the cumulative portion of canopy contributing to the chronology.

