
Figure 10.
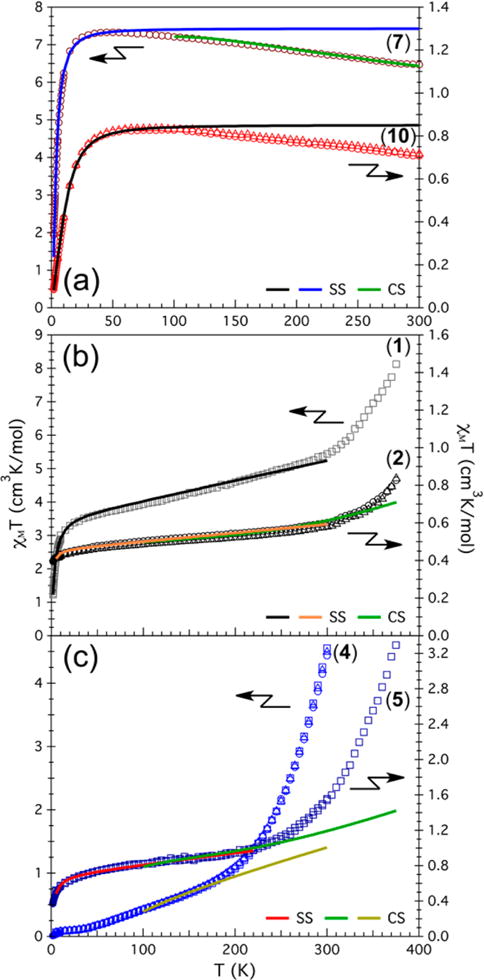
Variable-temperature dc magnetic susceptibility data, χMT for (a) cyanide species 7 (maroon) and 10 (red), (b) acetonitrile adducts 1 (gray) and 2 (black), and (c) DMF adducts 4 (blue) and 5 (navy blue). Experimental data are shown as open symbols for 0.1 T (squares), 0.5 T (triangles), and 1 T (circles). Solid lines correspond to fits (or simulations) to the models described in the main text.