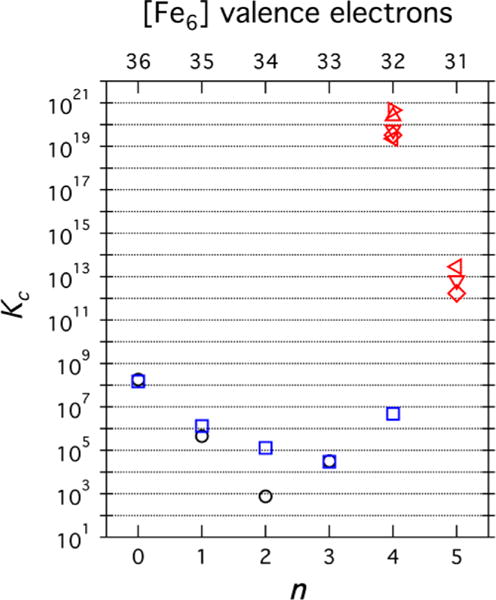
Figure 8.

Comproportionation constants versus n (bottom axis) and versus the total number of [Fe6] valence electrons (top axis). Black circles correspond to the MeCN adduct series, blue squares to the DMF series, and red symbols to the cyanide series in five different solvents.
