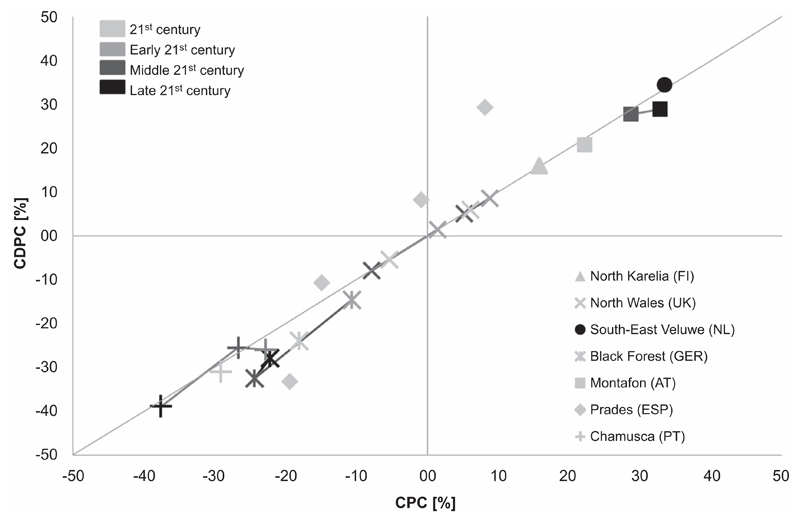
Figure 2.
Relative climate change-induced productivity changes with (CDPC) and without (CPC) accounting for disturbances in different forest case studies in Europe. Legend details: 21st century = long-term average over the entire 21st century, Early 21st century = early 21st century average (ca 2000–2040), Middle 21st century = mid-21st century average (ca 2040–2070), Late 21st century = late 21st century average (ca 2070–2100). The exact dates vary slightly according to the different models and are listed in table SOM2. Symbols linked by lines indicate a temporal sequence of results. The horizontal and vertical lines indicate ‘no change’ and the diagonal line is a 1:1 line. Points above the 1:1 line indicate increased productivity as a result of disturbance, while points below it illustrate cases where disturbances decrease productivity.

