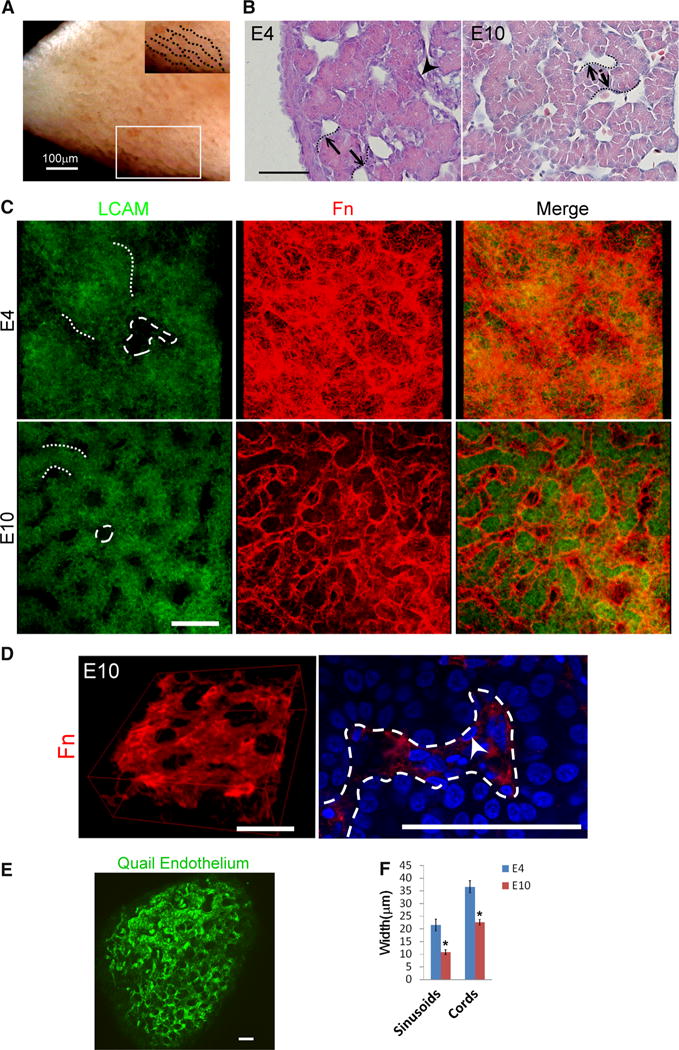
Fig. 1.

Morphogenesis of 3D hepatic cords and sinusoids. a, b Gross view and HE staining of chicken liver. Note the hepatic cords form with tube-like organization. c Two and three-dimensional staining of LCAM, and Fn staining of embryonic livers. Note that hepatic sinusoids gradually form a three-dimensional “cage-like” structure encircling peri-sinusoidal cells. d Fn immunofluorescence staining (red) of E10 liver. Left: three-dimensional reconstruction of the confocal images. Right: high-power view of Fn expression showed Fn-encircled peri-sinusoidal cells (arrow). Sinusoids are indicated by the dashed line. e Endothelial marker staining of E5 quail livers also shows the cage-like structures. f Quantification of sinusoidal and hepatic cord width. Note that the widths of hepatic cords and sinusoids decrease as the liver develops (*p < 0.05). Size bar 50 μm unless otherwise indicated, dotted lines hepatic cords, dashed lines sinusoids, arrowheads peri-sinusoidal cells. For f, 10 randomly selected sinusoids and hepatic cords from each liver sample (n = 3) were used to calculate the average width
