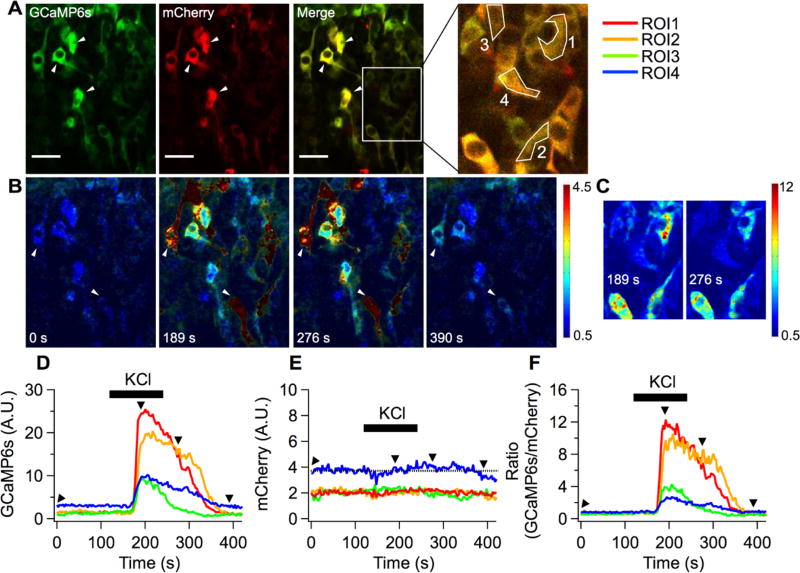
Figure 4.
Functional GCaMP-R-6s expressed in developing chicken neural tube. (A) Average images of GCaMP6s and mCherry obtained in Ringer’s solution. Four regions of interest (ROI1–4) located at cell bodies were chosen for calculating mean fluorescence intensity of GCaMP6s and mCherry. Scale bars, 25 µm. (B) KCl solution was applied to the neural tube to evoke depolarization-induced calcium influx during a time-series recording. Due to the bath perfusion configuration, KCl responses were delayed by ~50 s. Pseudo-color ratiometric images were displayed to estimate relative calcium elevations in cells expressing varying levels of the sensor. Four images were corresponding to time points shown in D, GCaMP6s; E, mCherry; and F, ratio of GCaMP6s over mCherry as black arrowheads. (C) Subset images including the four ROIs at two different time points shown in F were chosen to display the full range of ratios.

