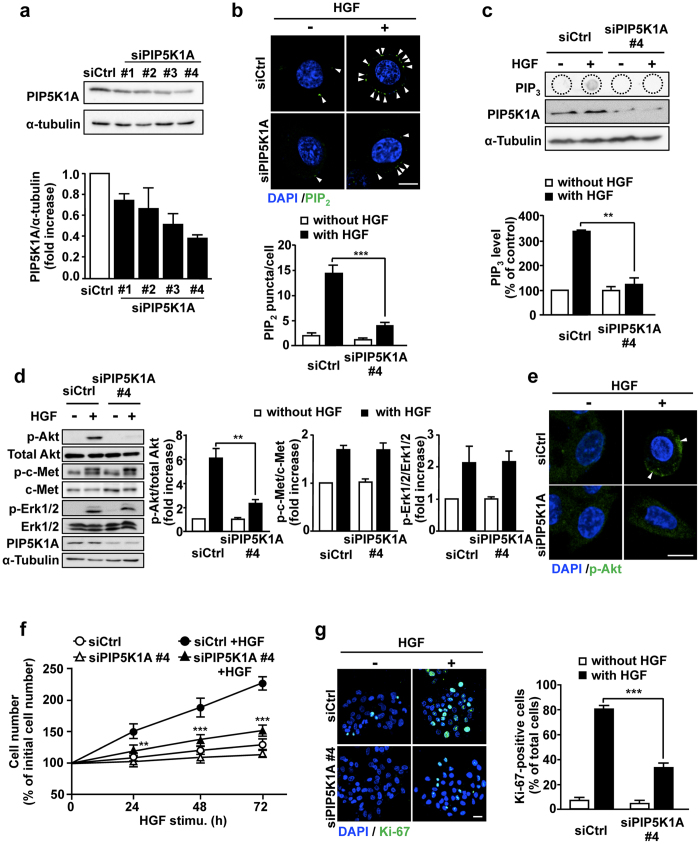
Figure 4.
Knockdown of PIP5K1A in HepG2 cells suppresses HGF-dependent PIP2 and PIP3 production, Akt activation and cell proliferation. (a) HepG2 cells were transfected with 10 nM of siRNAs for control and for PIP5K1A, and the PIP5K1A protein levels were detected by Western blotting (upper panels) and quantified (lower panel). (b–e) HepG2 cells transfected with siRNAs for control and PIP5K1A were simulated with HGF as in Fig. 1a, and PIP2 production (b), PIP3 production (c), Akt phosphorylation (d), and subcellular localization of p-Akt (e) were assessed as in Figs 2b, 2a, 1e and 1f, respectively. Phosphorylation of c-Met and Erk (d) were assessed as in Fig. 1g. Nuclei were also stained with DAPI (b,e). Green, PIP2 in (b) and p-Akt in (e); Blue, DAPI. Scale bars, 10 μm. (f,g) HGF-dependent proliferation of PIP5K1A-knocked-down HepG2 cells was assessed by counting cell number (f) and staining Ki-67 (g). Scale bar, 20 μm. Nuclei were also stained with DAPI in Fig. 4g. The quantitative results shown are means ± SEM from at least three independent experiments. Statistical analyses: two-way ANOVA with post hoc Bonferroni’s test. **p < 0.01; ***p < 0.001. Blots shown in (a,c) and (d) are cropped images. The full-length blots are presented in Supplementary Figure.

