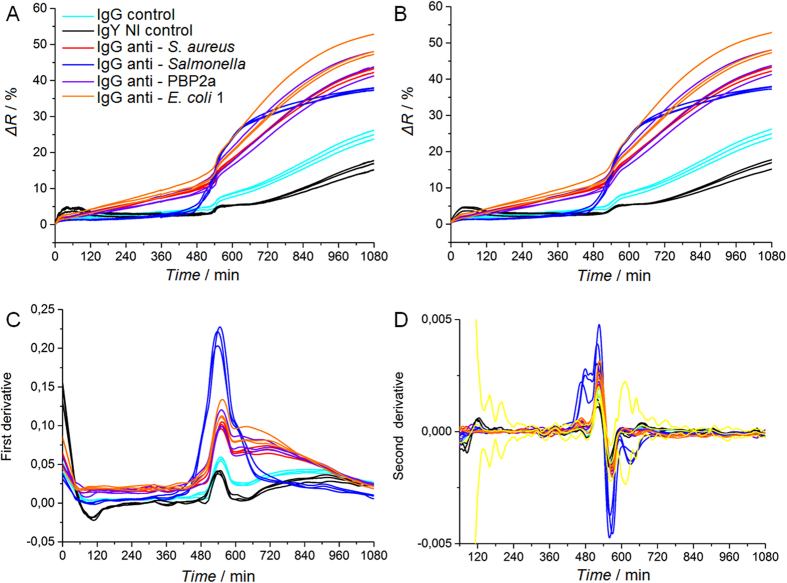
Figure 4.
SPRi data analysis and assessment of characteristic detection times. The detection of Salmonella Enteritidis, with an initial bacterial load of 14 ± 6 CFU.mL−1, is carried in a 1 mL volume composed of blood culture medium and human blood (10:1 ratio). (A) Raw SPRi data. (B) SPRi data smoothed with a Savitzky-Golay filter. (C) First derivatives of SPRi data. (D) Second derivatives of SPRi data. Yellow curves represent the averaged SPRi signal of IgY NI and IgG controls plus or minus five standard deviations. These data thus define the threshold values for positivity assessment.

