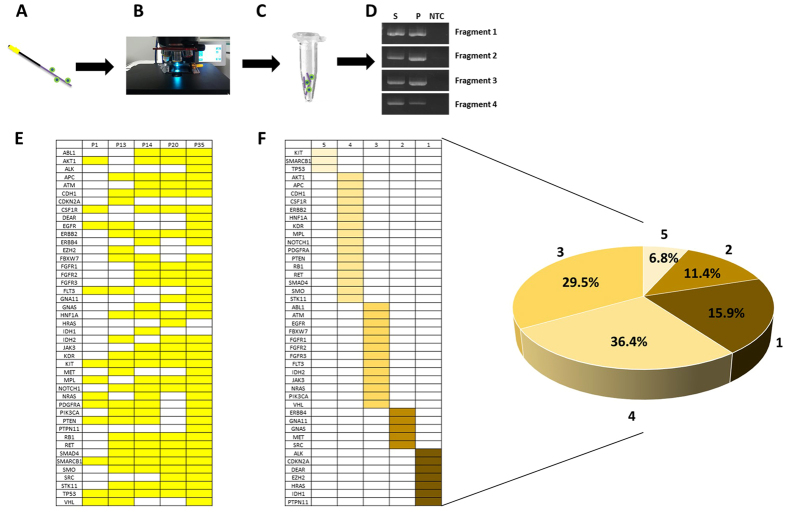
Figure 4.
Next-generation sequencing analysis in captured CTC. (A–D) Cells isolated with the CellCollector were analyzed microscopically by means of immunofluorescence staining according to the staining procedure in the clinical setup (A,B). Cell Collector was fragmented and subjected to WGA (C). After WGA, quality of WGA DAN was analyzed with PCR assay. Four specific fragments were amplificated with WGA DNA, PBMC and ultrapure water. S, indicated WGA DNA; P indicated positive control; NTC indicated ultrapure water. (E) Gene mutations were analyzed with Hotspot panel v2 in five patients’ CTCs. Different colors indicated specific mutation sites in patients. (F) Cancer-related mutation genes were shown with form and pie chart. Different colors indicated different proportion. Numbers one to five indicated gene mutation exist in patient number.

