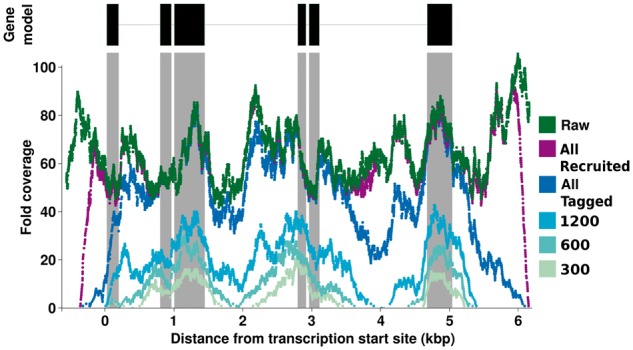
Fig. 1.

Genomic read tagging by progressive Bloom filter. Fold coverage of tagged reads is shown at points in time (first 300, 600 and 1200 and all tagged reads) during a single run with the C.elegans C17E4.10 gene as target. The raw read coverage is indicated solely as a baseline, to show the tagging process of the progressive Bloom filter. The final recruited coverage is shown in purple after the second stage of Kollector has collected all the reads. The fold coverage was calculated after read alignment to the reference transcript. In the Gene Model track, the black rectangles depict the exons and the connecting grey line depicts the introns
